Wait, we need data. Numpy is scientific, let’s use a numpy.
import numpy as np
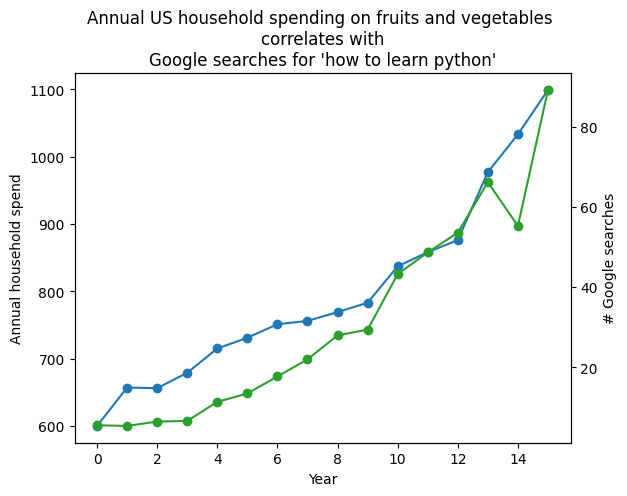
household_spending = np.array([600,657,656,679,715,731,751,756,769,783,837,858,876,977,1033,1099,])
google_searches = np.array([5.58333,5.41667,6.5,6.66667,11.4167,13.5,17.75,22,28,29.4167,43.25,48.6667,53.5833,66.1667,55.25,89.1667,])Graphs are scientific, let’s do a graph.
from matplotlib import pyplot as plt

fig, ax1 = plt.subplots()
ax1.plot(household_spending, marker='o')
ax1.set_ylabel("Annual household spend")

ax2 = ax1.twinx()
ax2.plot(google_searches, 'C2', marker='o')
ax2.set_ylabel("# Google searches")

ax1.set_xlabel("Year")

ax1.set_title(
    "Annual US household spending on fruits and vegetables \ncorrelates with\nGoogle searches for 'how to learn python'"
);
P-values are scientific. Let’s win the P-value.
from scipy import stats

# Calculate Pearson correlation coefficient and p-value
correlation, p_value = stats.pearsonr(household_spending, google_searches)