Let’s import some things...
from ipywidgets import interact, IntSlider
from IPython.display import Markdown, display
from tqdm.notebook import trange, tqdm
from time import sleep
import numpy as np
import matplotlib.pyplot as plt
%matplotlib inline

from ipywidgets import interact, interactive
from IPython.display import clear_output, display, HTML

import numpy as np
from scipy import integrate

from matplotlib import pyplot as plt
from mpl_toolkits.mplot3d import Axes3D
from matplotlib.colors import cnames
from matplotlib import animation
Cookies with Markdown
This is from someone else’s test notebook, it’s great though!
Te Quiero Demasiado
A little sprinkle of TQDM
for i in trange(2, desc='1st loop'):
    for j in tqdm(range(100), desc='2nd loop'):
        sleep(0.01)
Loading...
Loading...
Loading...
def solve_lorenz(
  N=10, angle=0.0, max_time=4.0,
  sigma=10.0, beta=8./3, rho=28.0):

    fig = plt.figure()
    ax = fig.add_axes([0, 0, 1, 1], projection='3d')
    ax.axis('off')

    # prepare the axes limits
    ax.set_xlim((-25, 25))
    ax.set_ylim((-35, 35))
    ax.set_zlim((5, 55))

    def lorenz_deriv(x_y_z, t0, sigma=sigma, beta=beta, rho=rho):
        """Compute the time-derivative of a Lorenz system."""
        x, y, z = x_y_z
        return [sigma * (y - x), x * (rho - z) - y, x * y - beta * z]

    # Choose random starting points, uniformly distributed from -15 to 15
    np.random.seed(1)
    x0 = -15 + 30 * np.random.random((N, 3))

    # Solve for the trajectories
    t = np.linspace(0, max_time, int(250*max_time))
    x_t = np.asarray([integrate.odeint(lorenz_deriv, x0i, t)
                      for x0i in x0])

    # choose a different color for each trajectory
    colors = plt.cm.viridis(np.linspace(0, 1, N))

    for i in range(N):
        x, y, z = x_t[i,:,:].T
        lines = ax.plot(x, y, z, '-', c=colors[i])
        plt.setp(lines, linewidth=2)

    ax.view_init(30, angle)
    plt.show()

    return t, x_t

w = interactive(solve_lorenz, angle=(0.,360.), max_time=(0.1, 4.0),
                N=(0,50), sigma=(0.0,50.0), rho=(0.0,50.0))
display(w)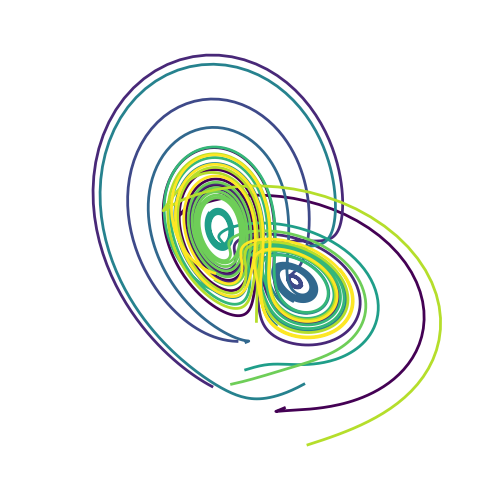
Loading...