MyST supports embedding of notebook content and other files. The following are some examples using the embed directive.
A Matplotlib Output
Source:Matplotlib
x, y = koch_snowflake(order=5)

plt.figure(figsize=(8, 8))
plt.axis('equal')
plt.fill(x, y)
plt.show()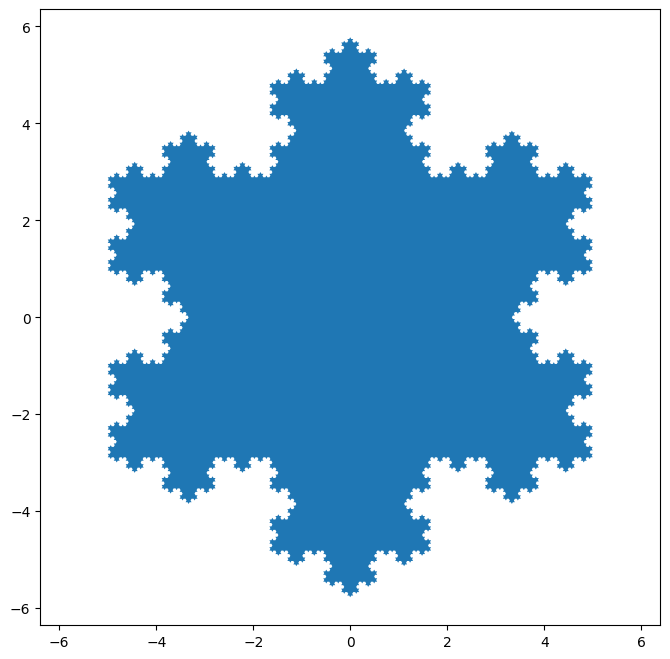
Embed a Plotly output
Source:Plotly
# Number of data points
N = 10000

# Generate random data
x = np.random.randn(N)
y = np.random.randn(N).astype('float32')
z = np.random.randint(size=N, low=0, high=256, dtype='uint8')
c = np.random.randint(size=N, low=-10, high=10, dtype='int8')

fig = go.Figure(data=[go.Scatter3d(
    x=x,
    y=y,
    z=z,
    marker=dict(color=c),
    mode='markers',
    opacity=0.2
)])

fig.show()
Loading...
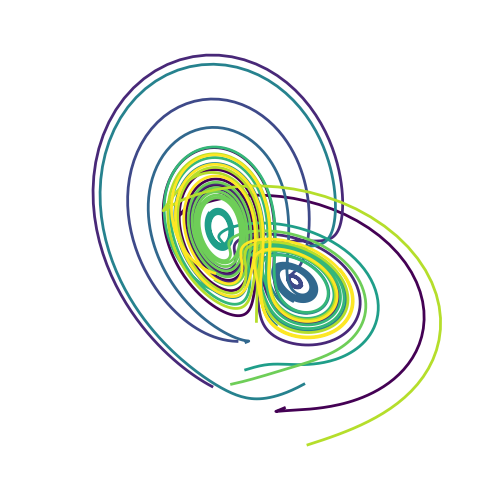
Embed a Bokeh output
Source:Bokeh
sigma = 10
rho = 28
beta = 8.0/3
theta = 3 * np.pi / 4

def lorenz(xyz, t):
    x, y, z = xyz
    x_dot = sigma * (y - x)
    y_dot = x * rho - x * z - y
    z_dot = x * y - beta* z
    return [x_dot, y_dot, z_dot]

initial = (-10, -7, 35)
t = np.arange(0, 100, 0.006)

solution = odeint(lorenz, initial, t)

x = solution[:, 0]
y = solution[:, 1]
z = solution[:, 2]
xprime = np.cos(theta) * x - np.sin(theta) * y

colors = ["#C6DBEF", "#9ECAE1", "#6BAED6", "#4292C6", "#2171B5", "#08519C", "#08306B"]

p = figure(title="Lorenz attractor example", background_fill_color="#fafafa")

p.multi_line(np.array_split(xprime, 7), np.array_split(z, 7),
             line_color=colors, line_alpha=0.8, line_width=1.5)

show(p)
Loading...
Loading...
Embed some sympy output
Embed some maths
Embed a manual equation
Embed some markdown generated in an output
Source:Markup Generation
Loading...
Embed some ipywidgets
Source:Widgets
Loading...
Embed some ipywidgets (precomputed outputs, ipynb)
Source:Widgets (ipynb)
Loading...
Embed a cell with multiple outputs
'Displaying some plain text above the rabbit'
Loading...
Loading...